Census Data
How did Texas perform in the 2020 Census compared to other states?

Visit the U.S. Census Bureau website to explore each state’s 2020 Census rates.
Visit the U.S. Census Bureau website to explore each state’s 2020 Census rates.
Explore our video series on Census rates & analysis!
VIDEO 1
2020 Census Self-Response Rate
State By State Comparison
VIDEO 2
2020 Census Self-Response Rate
County By County in Texas
Census Dashboard: Explore and Interact with The Data
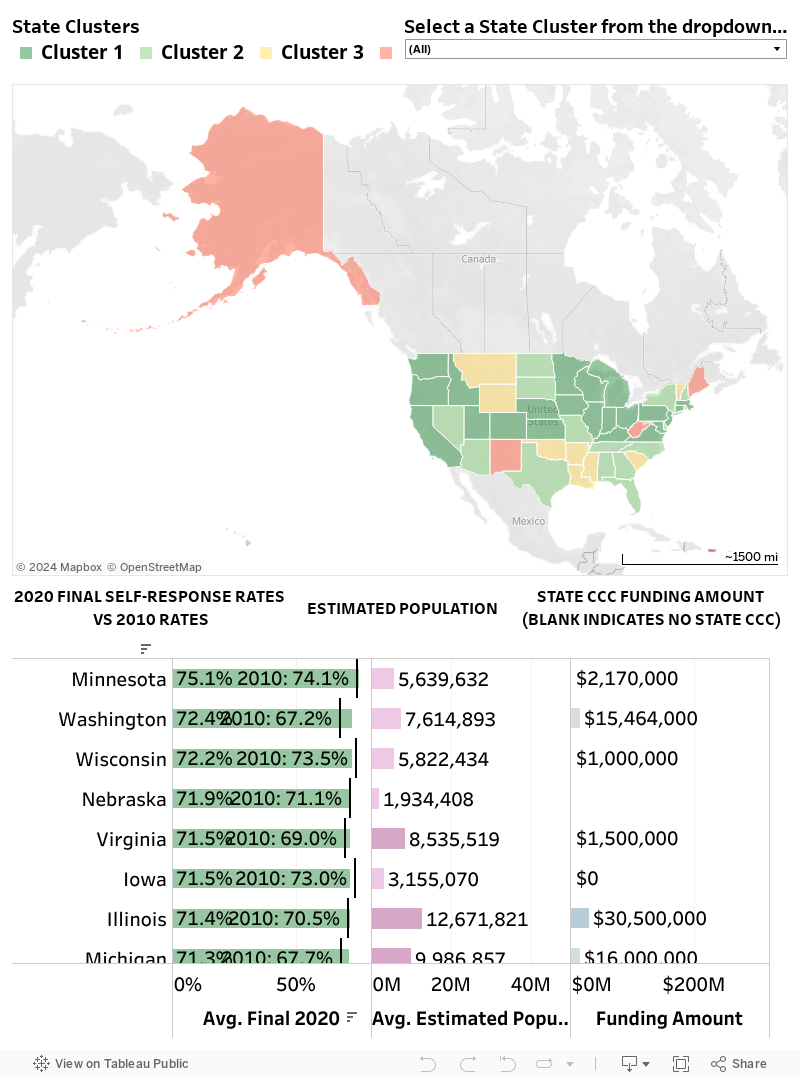
State Dashboard (Corresponds to Video 1)
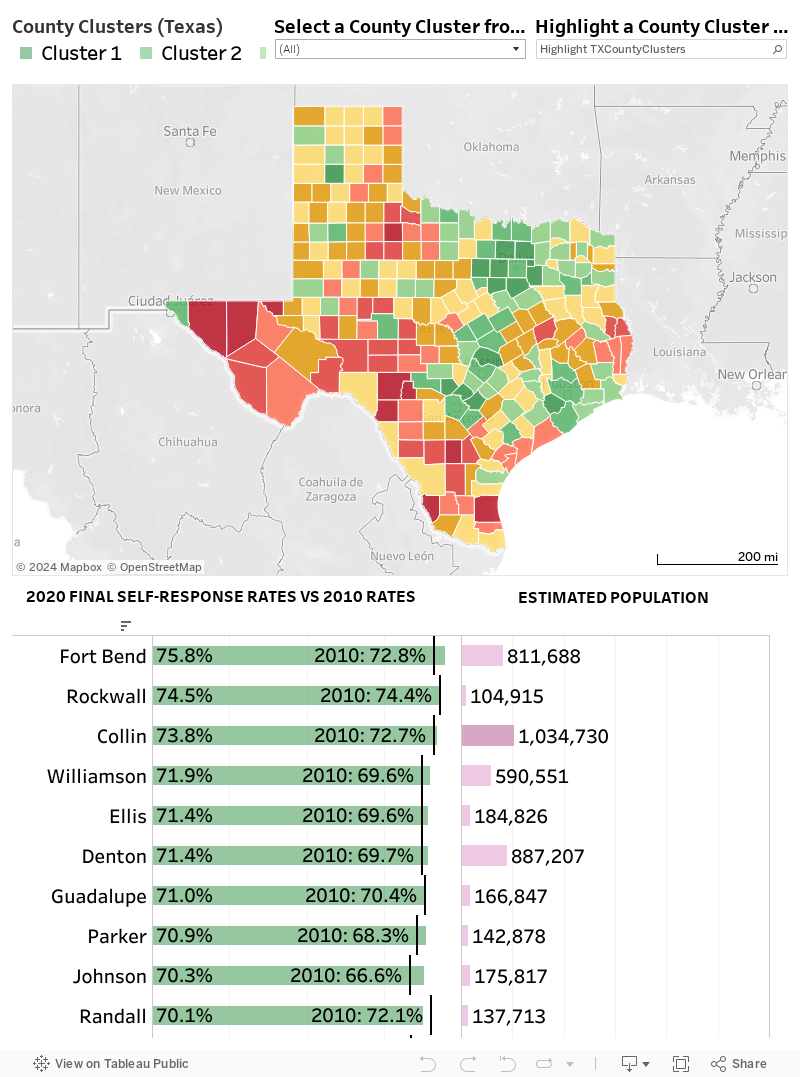
County Dashboard (Corresponds to Video 2)
Source: 2019 ACS Tables and 2020 Self-Response Rate tables can be found here.
Dashboard Instructions
You can click the play button on the top left to choose other interaction options:
Zoom Area: click and drag a rectangle to zoom into that rectangle
Pan: click and drag to move the map based on the direction of your dragging
Rectangle (default): click and drag on multiple states or counties on the map; this will only show the relevant states or counties in the graphs below.
Radial: same as Rectangle, but with a circular shape
Lasso: same as Rectangle, but with a shape conforming to your cursor movement
- You can click on the Zoom Home button to return the map to the default view
- You can press the + or – buttons to zoom in or out.
- You can also move your scroll wheel on your mouse (if available) to zoom in or out, as well
Other ways to interact with the graph:
- You can click and drag multiple bars to select multiple states or counties; this will highlight the relevant states or counties in the map.
- You can also individually choose multiple bars to select by holding down the Ctrl button whilst clicking multiple bars.
- You can sort the graph by clicking the dropdown arrow to the right of the sort button over the state or county names.
Cluster Definitions
(By Self-Response Rate)
State clusters:
- Cluster 1: 68-75%
- Cluster 2: 63-68%
- Cluster 3: 60-61%
- Cluster 4: 55-59%
- Cluster 5: Puerto Rico
County clusters:
- Cluster 1: 68-76%
- Cluster 2: 61-67%
- Cluster 3: 56-61%
- Cluster 4: 50-56%
- Cluster 5: 43-50%
- Cluster 6: 36-41%
- Cluster 7: 27-35%
- Cluster 8: 18-27%